Following up on our recent post about Monitoring Spark applications - we held a meetup sharing the same ideas and tips (with a few updates and insights).
Here is the video (HEBREW):
And the slides:
Enjoy!
Sunday, March 20, 2016

Monday, November 16, 2015
Spark Monitoring - Tips from the Trenches
The Challenge
So you’re using Apache Spark - Yay!
You’ve been through the fun parts of getting to know Spark’s fluent and rich API, perhaps using Scala; You’ve seen how fast you can go from "nothing" to a "working job" with Spark’s standalone mode; You’ve then witnessed the natural integration with Hadoop-stack technologies like YARN and HDFS, and deployed your job onto a real live cluster! You even managed to stay humble enough to employ your Continuous Integration and Deployment tools, and created a reliable, automatic testing pipeline for your code, congrats!
Done?
As always, the answer is No. The almighty Pareto principle is right again - you got 80% of the work done, but somehow 80% of the effort is still ahead of you. Because “working”, “working well” and “stays working” are not the same, and you’ve learnt that before.
So what’s missing? Feedback.
So what’s missing? Feedback.
- Like every framework, Apache Spark only works so-well if you treat it as a blackbox; To get optimal performance, you'll need to tweak it quite a lot, and for that - you'll need to know what works well and what doesn't
- Apache Spark is a data processing framework, and data has that annoying tendency to change, evolve, or just grow. You need to know about these when they happen
- Although Spark is impressively fault-tolerant, that’s far from saying there are no faults you'll have to handle yourself. If your code always throws IllegalArgumentException for a specific input, no retry would save you
- Distributed systems involve a higher level of complexity, rendering most ad-hoc troubleshooting techniques unusable or harder (“tail log file? Where?”), so you'll need to know where and how to look when something goes south
- If you’re not yet using the DataFrames API, but rather building detailed RDD transformations yourself using the Core API - you'll easily create a sub-optimal flow, resulting in slowness, and you’ll need to know when that happens
Let’s do it then!
Monitoring is a broad term, and there’s an abundance of tools and techniques applicable for monitoring Spark applications: open-source and commercial, built-in or external to Spark. I’ll describe the tools we found useful here at Kenshoo, and what they were useful for, so that you can pick-and-choose what can solve your own needs. Most likely, it will take more than one tool or technique to get all the feedback you require.
Spark’s built-in UI
Spark UI (accessible on driver app's port 4040, by default, or via Spark's History Server) is the first place you'd want to check: you'd go there to verify system is up, to see what’s being executed now, and to get a feeling of what’s fast and what’s slow. In the Jobs view, you can easily identify failed or slow jobs (if the terms job, stage and task are not familiar to you - checkout this excellent talk by Aaron Davidson); drilling down into a specific job shows you the Stages executed for this job, and a nice “DAG Visualization” of the pipeline comprised of these stages, e.g.:
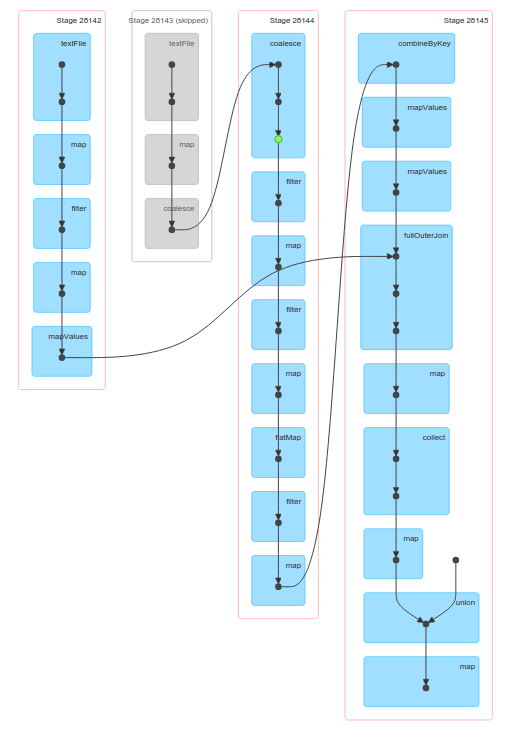
This visualization is specifically useful for identifying RDDs that would benefit from being cached - any “fork” in the graph is a good candidate for caching - as more than one stage will have to calculate the result up to that forking point.
If you drill down further into to a specific Stage, you’ll see its Tasks, the smallest autonomous units of processing in Spark. The detailed data per task can help identify your current bottleneck (large shuffles, GC time, “straggler” tasks taking much longer than others etc.). For example, in this zoomed-out Event Timeline (showing all tasks placed on a timeline and grouped by executor), can you spot the one node being much slower than the others?
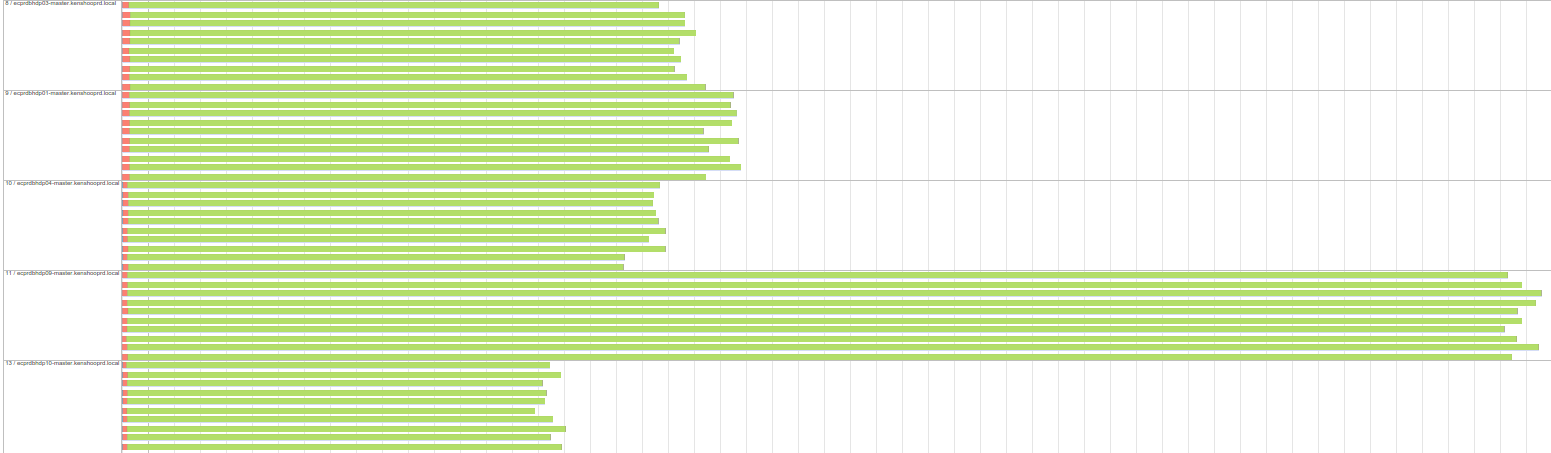
The Tasks page also aggregates this information by executor, making it easy to isolate issues with specific nodes. There's also a useful Executors page showing some high-level stats for currently-running executors. Altogether, the Spark UI is definitely the place to start with for any new Spark code: the big issues will make themselves visible immediately.
Spark’s REST API
Though nice and intuitive, the UI is only useful for looking at one item at a time, but is lacking when you want to derive insights from many jobs or stages at once. That’s when you can use Spark’s REST API - it gives you programmatic access to exactly the same data you see in the UI, but now - you can manipulate it as you’d like.
For example, at one point we’ve asked ourselves “how much of the shuffle data gets spilled to disk, if at all”, during a day-long execution of various jobs, in an attempt to make some informed decisions for setting “spark.shuffle.memoryFraction”. Looking for this information in the UI is futile when you have many jobs, each potentially behaving differently. So, we wrote this little piece of Scala code, to fetch, parse and sum the data for all stages:
The printed result:
stages count: 1435
shuffleWriteBytes: 8488622429
memoryBytesSpilled: 120107947855
diskBytesSpilled: 1505616236
And now we know ~120GB spilled to disk - perhaps we can increase the memoryFraction for shuffle to speed things up! Or maybe we should now improve this code to see what types of stages spill to disk, and handle them specifically?
Other questions of this nature were solved just as easily using other REST API end-points (jobs, storage).
Other questions of this nature were solved just as easily using other REST API end-points (jobs, storage).
Setting up Spark’s Sinks
So these were all manual methods to analyze Spark’s performance post-hoc. What about getting some near-real time information you can act upon? The good folks writing Spark thought about that too, and they collect some interesting internal metrics using the Metrics java library (which we use extensively in Kenshoo as well). These metrics are collected into some in-memory registry on every Spark component (driver application, master, and every executor), but where does it go from there? That’s up to you: you can use Spark’s configuration to set up different sinks for these metrics to "spill" into. In our case, we chose to set up a Graphite sink, since Graphite is where we send all our application metrics (use metrics.properties.template to create the required metrics.properties file). What did we get from this? Well, for example, we can monitor the heap usage on each of our worker nodes:
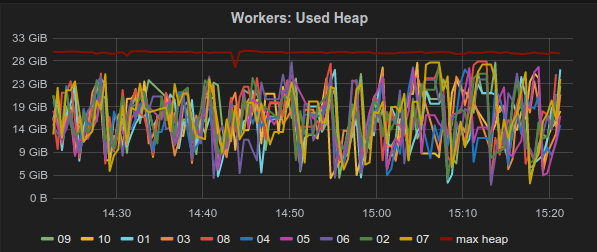
Other useful metrics include number of current jobs and applications, and various JVM information for every component.
Accumulator-based counters
So far we’ve mostly covered Spark’s internals. Another dire need is getting similar data specific to your application. Your data has characteristics you should know about - for example - if you get batches of different sizes, you’d want to know the distribution of these sizes (e.g. mean, max, min..) to optimize your code accordingly.
This specific example often requires counting records in your RDDs. In some cases - this is easy: if your RDD is cached, another count() operation won’t cost much, and is easy to code and send as a metric to graphite. But what if you don’t want to cache this RDD, and you know you’re going to scan it exactly once - is there an efficient way to count records without another scan? This is exactly why Spark authors implemented Accumulators, and in Kenshoo we’ve combined these accumulators with Metrics’ Counters, to have a live metric displaying number of records that passed through a certain pipeline. Here’s a rough example:
The result - more graphs in Graphite!
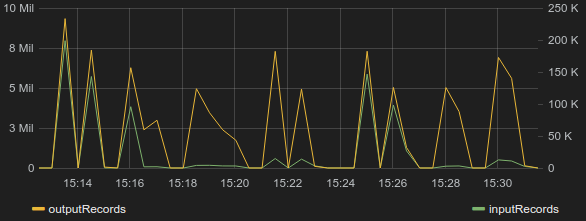
This reusable piece of code makes it rather easy to know how many records pass through any calculation. We've also reduced the annoyance of carrying the "callback" methods through the code by registering them to some "listener" that calls all of them at the end of the entire flow (note that if you call them before any action triggers the RDD evaluation, accumulators will stay zero).
Cache Usage
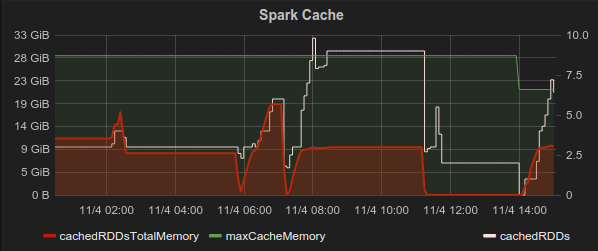
Back to some Spark internals, we recently wanted to know how much of the available cache memory is actually used (to see if we are over/under allocating spark.storage.memoryFraction). Spark doesn’t expose this information in the form of metrics (though it could), but as this post suggests - SparkContext offers access to this information, so all that’s left for us to do is to wrap it with a few Metrics Gauges, to be presented in Graphite like everything else:
And once again, this gives you a useful graphic representation of your system's behavior:
And the list goes on...
Improving our monitoring is a constant theme that accompanies every feature and every new Spark application. These were just a few examples we found interesting or especially useful, but there's plenty more tools and metrics we're using to know how well our apps behave. The bottom line is neither surprising, nor new: the process of building good monitoring must be well structured:
- Ask clear questions first (e.g. "how much cache memory is used")
- Check your existing tools (e.g. Spark UI, Metrics+Graphite) to see if they can answer them
- If not - check for other existing tools that can
Monday, November 2, 2015
GitHub Best Practices for Optimal Collaboration
Kenshoo has been using GitHub intensively for about 3 years now. All of our code, with no exception, is managed on GitHub, spread across hundreds of private or public repositories and updated by hundreds of developers.
While Git and GitHub do most of the heavy-lifting needed to enable effective collaboration, over time we have developed some best practices to keep us all in sync, and to make the best of these powerful tools. New developers learn these from their teammates, and shortly become effective contributors and reviewers.
Here's a list of DOs and DONTs we've been following, which we believe could be helpful for other teams, large are small alike:
Git:
While Git and GitHub do most of the heavy-lifting needed to enable effective collaboration, over time we have developed some best practices to keep us all in sync, and to make the best of these powerful tools. New developers learn these from their teammates, and shortly become effective contributors and reviewers.
Here's a list of DOs and DONTs we've been following, which we believe could be helpful for other teams, large are small alike:
Git:
- No commits to master - code is committed only into short-lived feature branches, later merged into master via Pull Requests (PRs) - there's no other way for code to enter the mainline. We even enforce this using GitHub's Protected Branches feature
- Give your branches meaningful names, like everything else you name, really
- Use rebase to update your local master: you shouldn’t have conflicts - you didn’t commit anything directly to master because you followed tip #1, right?
- Use rebase to update a feature branch with changes from master: unless there are other committers working on that branch right now, rebasing (and thus "rewriting history") creates a "fresh start" as if your feature branch included these updates in the first place
- Squash commits before merging to master: again, unless other committers are still working on the same branch, squashing makes the history more concise and readable
Pull Requests:
- Give detailed Pull Request descriptions, this will make your reviewers’ lives easier. Use links, attachments, bullets - whatever your teammates might need to understand exactly what you did and why you did it

- Do not merge your own PRs: every PR is reviewed and merged by peers, do not merge your own and and do not merge others' without reviewing
- Feel free to comment on your own PRs if you'd like to point something out to your reviewer. For example, comment on a specific line you've changed if it's unclear why you had to change it
- @Mention users if you want their opinion, it works!
- Delete branch after merging a Pull Request: it’s the same button, you’ll see it

Code Reviews:
- Review everything: we're strong believers in code review as a means of quality assurance, standardization and knowledge sharing, so much so that we've created a nice little tool to "gamify" the process: developers get points for reviewing PRs, and top reviewers are celebrated. Here's how this looks for GitHub's own open-sourced repositories:

- Elaborate: be clear, explain your reasoning, give examples - these are harder to misunderstand and easier to agree upon
- Use common terminology - this will help turning "opinions" into familiar idioms
- Give positive feedback too when reviewing code - not just because it feels good, because it shines a light on the good ideas
- Write down the conclusion even if you reached it offline: we often turn to a year-old Pull Request's discussion page to understand why the code looks the way it does. Make sure your discussions, like your code, are readable to potential future developers trying to follow your reasoning


Got your own best practices? Share them in the comments below, we'd love to learn!
Thursday, February 5, 2015
Writing Pluggable code using IoC and Lists
One of the main requirements and sources of difficulties we software developers face is the need to write code that can both be easily reused and expanded later to meet new product requirements. In the following post I will try to present a way of doing that using Lists with injected values.
In order to understand this post you need to a basic understanding of IoC in general (wiki link)
and since since this example uses Spring Framework, you should have a fair understanding of that as well.
I’ll be using Spring framework's @Autowired to inject dependencies but this works just as well with @Inject @Resoruce etc.
and since since this example uses Spring Framework, you should have a fair understanding of that as well.
I’ll be using Spring framework's @Autowired to inject dependencies but this works just as well with @Inject @Resoruce etc.
As a first example, assume we have an interface called Validator and two classes that implement it: MaxLenghValidator and MinLengthValidator. Any class that now contains an @Autowired list of Validator's will be injected with two items in the list, namely: MaxLengthValidator and MinLenghValidator. If we create new implementations of Validator, this injected list will change automatically.
This simple pattern can be used to effectively solve a variety of problems. One such example is implementing the Chain of Responsibility design pattern (a good article about it can be found here: http://rdafbn.blogspot.ie/2012/11/chain-of-responsibility-using-spring.html)
That's the basic use-pattern of @Autowired lists.
Now let’s see how this can allow us to easy expand our code.
We do that by first choosing the right module architecture. Looking at the example above, one appropriate module architecture might be:
- (Module)Validator-API (Runtime dependency in Validator-Impl)
- Validator(I)
- ValidatorService(C)
- (Module)Validator-Impl (compile dependency in Validator-Api)
- Implements of Validator(C)
Notice the ValidatorService (which is part of Validator-API) is only run-time dependent on Validator-Impl. This means that at compile time, it only needs to know about the Validator interface, but not about any of its implementations - the latter are needed indeed only at run-time. This modeling allows us to add as many Validators as we'd like without changing anything in the ValidatorService.
What if we want to control the order in which the various Validators appear in the list? By default, list items inside @Autowired lists are added alphabetically. In order to explicitly state a different ordering, we can add an @Ordered class annotation - as shown in example 2
We can now try to create a full-fledged service, that validates entities, does some calculations on them and finally saves them. We'll want to write a generic service - that will do this for any Entity.
We will start with the API and Impl module structures above, and create an enum of EntityType and an Entity POJO.
We will start with the API and Impl module structures above, and create an enum of EntityType and an Entity POJO.
Then we can create the validate, calculation and save interfaces:
Finally we can create the EntityService interface, that will tie them all together:
That's it - we’ve finished the API, and can now proceed with the implementation layer.
Let's say we want to add a Campaign entity:
Let's say we want to add a Campaign entity:
Next we need to create an EntityServiceImpl:
Now each time doTheStuff method is called, it gets the stuff done by using the entity implementation provided.
Notice I’ve added a Map to hold each entity implementation for quick access. We can construct these maps using the @PostConstruct annotation, which is triggered right after the bean has been created and its members Autowired, including the aforementioned list. So now the list can be transformed into a map for quicker access.
Notice I’ve added a Map to hold each entity implementation for quick access. We can construct these maps using the @PostConstruct annotation, which is triggered right after the bean has been created and its members Autowired, including the aforementioned list. So now the list can be transformed into a map for quicker access.
This type of structure allows us to add as many Entities as we'd like, and our EntityService will be able to handle them automatically. This applies not only to our implementations - any external JAR containing classes that implement our interface will be added to our injected list due to its run-time dependency.
Speaking of external JAR's, we might want to allow others - either inside or outside of our organization - to be able to implement our interfaces more easy. So let's create an "interface of interfaces" that once implemented can be integrated to our system. In order to achieve this, we can create an EntityServiceProvider that can hold the various interface implementations for any EntityType. We then modify our EntityService to use it:
To wrap things up:
What we’ve shown is a pattern for creating flexible ("plug-in able") code which is both service-oriented and testable: each component is independent and can thus be tested separately: we can write separate unit tests for each component's logic, and a behavioral test for the wrapping service (EntityService) will provide good code coverage of the overall functionality.
What we’ve shown is a pattern for creating flexible ("plug-in able") code which is both service-oriented and testable: each component is independent and can thus be tested separately: we can write separate unit tests for each component's logic, and a behavioral test for the wrapping service (EntityService) will provide good code coverage of the overall functionality.
Here at Kenshoo our code needs to be expand regularly, for example to support new channels and new channel features. Hence we must have solid structures that enable new code to easily be integrated to existing code in our system - and we use this pattern extensively.
Tuesday, February 3, 2015
Validation of RESTful (Swagger) Documentation
Documenting an API is probably the most important part after creating it. After all, without good documentation an API is - useless. At Kenshoo we've chosen Swagger 2 to document our RESTful APIs.
About Swagger |
The goal of Swagger™ is to define a standard, language-agnostic interface to REST APIs which allows both humans and computers to discover and understand the capabilities of the service without access to source code, documentation, or through network traffic inspection. When properly defined via Swagger, a consumer can understand and interact with the remote service with a minimal amount of implementation logic. Similar to what interfaces have done for lower-level programming, Swagger removes the guesswork in calling the service.
Swagger Spec defines the specification. Swagger Editor provides a convenient web editor to edit and preview the documentation, and also some convenient examples to get started. Swagger UI visualizes the documentation as a human readable web page. |
With Swagger 2 the API descriptor is kept in a single yaml file:
But how can we validate that our documentation is accurate and matches the actual code?
The question becomes even more important as time passes and code evolves.
Do resources still exist? Were paths changed? Maybe properties were renamed?
One way of solving these issues would be to regenerate the documentation from code. But as we strongly believe in a "design first" approach - i.e. that documentation should be created before code - we looked for a different path, one that could allow us to write the documentation first, and then verify the code matches our design.
Swagger-validator is a new component we're open sourcing at Kenshoo, that aims to help verify that the documentation of an API matches the actual code.
In order to use it, all the developer needs to do is map the paths and definitions of the yaml file to the Java classes.
For example:
As you can see under each path a new custom element x-javaClass was added. It contains the fully qualified Java class name.
And that's all!
The validator can now run the necessary checks, throwing a meaningful exception if anything fails.
The validator can be activated as any other JVM process (be it Java, Scala, or Groovy), but the easiest way to run it is probably via a simple unit test:
So what's validated?
Resources are validated against their paths, using the @Path annotations their operations (GET, POST, etc.) have
Objects (definitions) are validated against the properties they carry - matching properties to object fields.
The current implementation uses Java 7.
The resources are validated with Jax-RS annotations.
The definitions are validated as POJOs.
Subscribe to:
Posts (Atom)